Ever looked at a huge spreadsheet and thought, “There must be a better way to do this?” Or spent hours updating reports, only to do it all over again next week? You’re not alone. When it comes to handling data, the Power BI vs Excel debate is more relevant than ever. Microsoft Excel has been the go-to tool for years, but as businesses deal with larger and more complex data, Power BI is becoming the smarter choice for automation and visualization.
Table of Contents
In this blog, we’ll break down Power BI vs Excel, comparing data handling, security, automation, dashboards, and costs. Whether you’re a small business owner, analyst, or manager, knowing when to use each tool can save time and help you make better decisions.
What is Microsoft Excel?

Excel is a popular spreadsheet program that’s been around since 1985. It’s like a digital version of the paper worksheets people used to use for math and accounting. Excel organizes your data in rows and columns where you can type in numbers, words, and math formulas.
Excel is good for:
- Storing information
- Doing calculations
- Making simple charts
- Daily business tasks
It works well when you need to enter data by hand, do math with your numbers, or make basic reports. While Excel isn’t great with huge amounts of data, it handles everyday tasks just fine. Even people who aren’t tech-savvy can learn the basics, and there’s room to learn more advanced stuff as you go.
Key Features of Microsoft Excel
1. Formulas and Functions
Excel is all about calculating things. It has hundreds of ready-made functions for math. You can add up numbers with SUM, find the middle value with AVERAGE, or search for specific info with VLOOKUP. These formulas work like shortcuts so you don’t have to do the math yourself.
2. Pivot Tables and Charts
Pivot tables help you make sense of lots of information. They let you quickly see things like total sales by region or product without writing new formulas. Charts turn your numbers into pictures like bar graphs or pie charts. Together, they help you spot trends and patterns that would be hard to see just looking at rows of numbers.
3. Productivity Tools
Excel has tools that save you time on tasks you do often. Macros record steps so you can replay them with one click. Templates give you ready-made spreadsheets for budgets or schedules. Conditional formatting highlights important information automatically, like showing negative numbers in red or using colors to show high and low values.
What is Microsoft Power BI?

Power BI is a tool that helps businesses understand their data through interactive charts and reports. Unlike Excel, which started as a spreadsheet program, Power BI was made specifically for analyzing and visualizing data. It turns raw numbers into colorful, interactive dashboards that update on their own.
Power BI connects to many data sources – from Excel files to databases to online services – and pulls all that information into one place. What makes Power BI special is how it handles large amounts of data smoothly and shows it in ways that are easy to understand. It’s like having someone who analyzes your data 24/7 and creates reports that you can interact with to find answers.
Also Read: Components of Power BI for Better Data Insights
Key Features of Power BI
1. Data Connectivity & Transformation
Power BI connects to all kinds of data sources – databases, spreadsheets, online services like Salesforce, even social media. Once connected, it helps clean up messy data by removing duplicates, fixing errors, and combining information from different places. This means less time formatting data and more time analyzing it. And once you set it up, these connections can refresh automatically so your data is always current.
2. Drag-and-Drop Visualizations
Making charts in Power BI is simple – just drag fields onto the page. Want to see sales by region? Drag those two fields and Power BI suggests a chart. Don’t like it? Change it with one click. These charts aren’t just pretty – they’re interactive. Click on a region and all other charts filter to show just that region’s data. This makes exploring data easy, even for people who aren’t data experts.
3. AI-Powered Insights
Power BI has built-in artificial intelligence that finds patterns people might miss. Ask questions in plain English like “What affected sales last month?” and the AI suggests answers. It can predict future trends, spot unusual patterns, and explain why numbers changed. These tools work in the background, highlighting important findings so you can focus on taking action rather than digging through data.
Also Read: What are Bookmarks in Power Bi- Types and Examples
Similarities Between Excel and Power BI
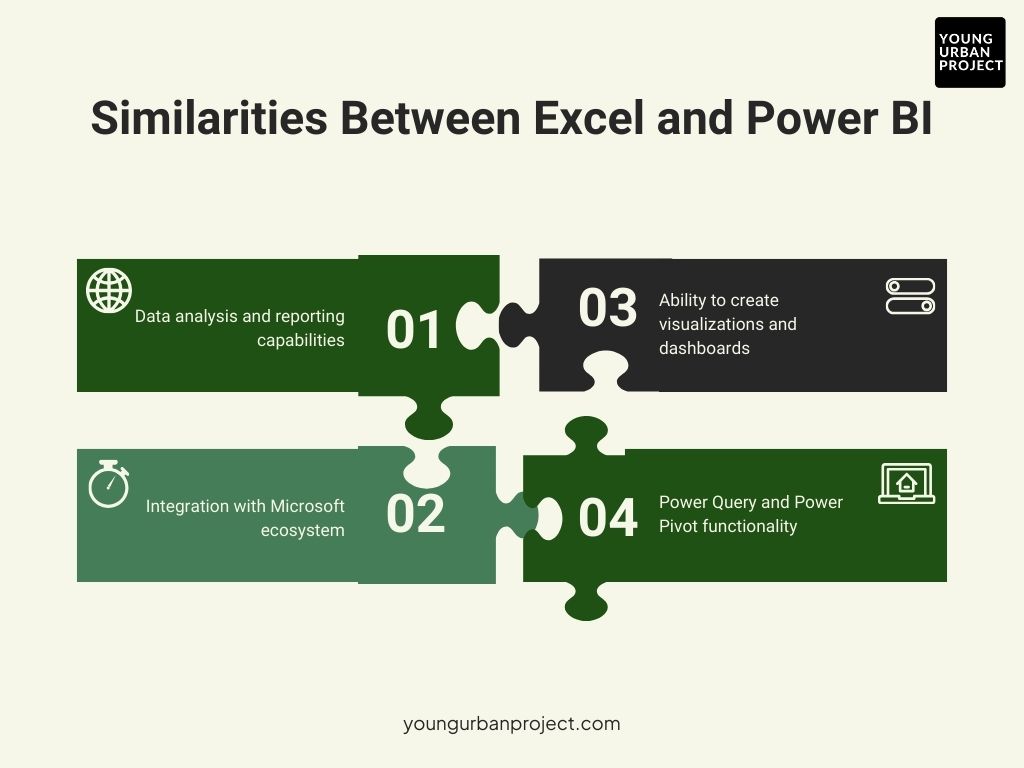
1. Data analysis and reporting capabilities
Both Excel and Power BI help you understand numbers and create reports. They can sort, filter, and organize data to answer business questions. Both tools let you highlight important information and present findings through charts and tables that help tell your data story to others.
2. Integration with Microsoft ecosystem
Excel and Power BI work well with other Microsoft products. They connect easily with OneDrive, SharePoint, and Teams for sharing. Both use similar formulas, making it easier to switch between them. They also work with Microsoft 365 apps, so you can use your data insights in documents, presentations, and emails.
3. Ability to create visualizations and dashboards
Both tools turn numbers into pictures that are easier to understand. You can create charts, graphs, and dashboards in either program to spot trends and patterns. While they work differently, both help people see what the numbers mean without having to look through rows of data.
4. Power Query and Power Pivot functionality
Both Excel and Power BI use Power Query to bring in and clean up data from different sources. They also share Power Pivot technology for creating data models and relationships between tables. This shared foundation means what you learn in Excel’s data tools helps you learn Power BI faster.
Power BI vs Excel: Dashboard Comparison
| Feature | Excel Dashboards | Power BI Dashboards |
| Data Source Connectivity | Mostly manual (CSV, Excel files, limited database connections) | Connects to multiple live sources (SQL, APIs, cloud services, real-time data) |
| Data Processing Speed | Slower with large datasets, especially when using formulas | Optimized for handling big data and complex calculations efficiently |
| Ease of Use | Requires manual setup for charts, pivot tables, and reports | Drag-and-drop interface for quick dashboard creation |
| Real-Time Updates | Data updates must be refreshed manually | Can connect to live data sources and refresh automatically |
| Report Sharing | Shared via email, OneDrive, or as an attachment | Cloud-based sharing with real-time collaboration |
| User Interactivity | Basic (slicers, filters) | Highly interactive (clickable visuals, drill-through, dynamic filters) |
| AI & Insights | No built-in AI; relies on formulas and manual analysis | AI-powered insights, anomaly detection, and forecasting |
| Best For | Small-scale reports, personal use, and ad-hoc analysis | Enterprise-wide reporting, interactive dashboards, and business intelligence |
Key Takeaways from the Dashboard Comparison:
- Excel dashboards are simple but require manual updates and are not ideal for big data.
- Power BI dashboards are fully interactive, handle real-time data, and offer AI-driven insights.
- If you need basic reports, Excel is enough; if you need dynamic, real-time dashboards, Power BI is the way to go.
Power BI vs Excel: Top Differences You Need to Know
| Feature | Excel | Power BI |
| Data Capacity | Handles up to 1 million rows but slows down with large datasets | Optimized for big data, can process millions of rows efficiently |
| Data Security | Password-protected files, limited security options | Role-based access, enterprise-grade security, cloud encryption |
| Flexibility | Best for manual data entry, spreadsheets, and basic calculations | Best for automation, large-scale analytics, and business intelligence |
| Learning Curve | Easy for basic tasks, but advanced features (VBA, Power Query) take time | Steeper learning curve but built for visual data analysis |
| Accessibility & Collaboration | Limited to file-sharing (email, OneDrive) | Cloud-based collaboration, accessible from anywhere |
| Visualization Options | Charts, pivot tables, and graphs | Interactive reports, AI-powered visuals, and real-time dashboards |
| Interactivity | Static reports with basic filtering | Clickable, interactive dashboards with drill-down features |
| Automation & AI Features | Uses VBA/macros for automation | Built-in AI insights, anomaly detection, and automated updates |
| Cost & Licensing | One-time purchase or Microsoft 365 subscription | Free version available, Pro and Premium require monthly fees |
| Customization & Extensibility | Uses VBA and add-ins for customization | Supports APIs, custom visuals, and Power Automate for workflow automation |
Key Takeaways from the Differences:
- Excel is best for small-scale data handling and ad-hoc analysis.
- Power BI excels in automation, real-time reporting, and handling large datasets.
- Power BI is better for businesses, while Excel remains a go-to for spreadsheet-based work.
Power BI vs Excel: Understanding When to Use Each Tool
1. Best use cases for Excel
Excel shines for personal productivity and ad-hoc analysis. It’s perfect when you need to quickly enter data, perform calculations, or create a simple report that won’t need frequent updates. Excel works best for smaller datasets (under 100,000 rows), straightforward analyses, and situations where you’re the main person working with the data. It’s also ideal when you need full control over every cell and calculation.
2. Best use cases for Power BI
Power BI is the right choice when dealing with large amounts of data from multiple sources. Use it when you need automated reporting that refreshes regularly without manual work. Power BI excels at creating interactive dashboards that others need to explore on their own terms. Choose it for company-wide reporting, situations requiring secure sharing with many users, and when you need advanced visualizations not available in Excel.
3. When to use them together in a workflow
Many businesses use both tools as part of their data strategy. Excel often serves as a data entry point or for quick analysis, with Power BI handling the heavy lifting of data processing and visualization. Export Excel data to Power BI for better visualization, or use Excel to do deeper dives into specific numbers identified in Power BI dashboards. This combination brings out the best in both tools.
How Excel Users Can Save Time with Power BI
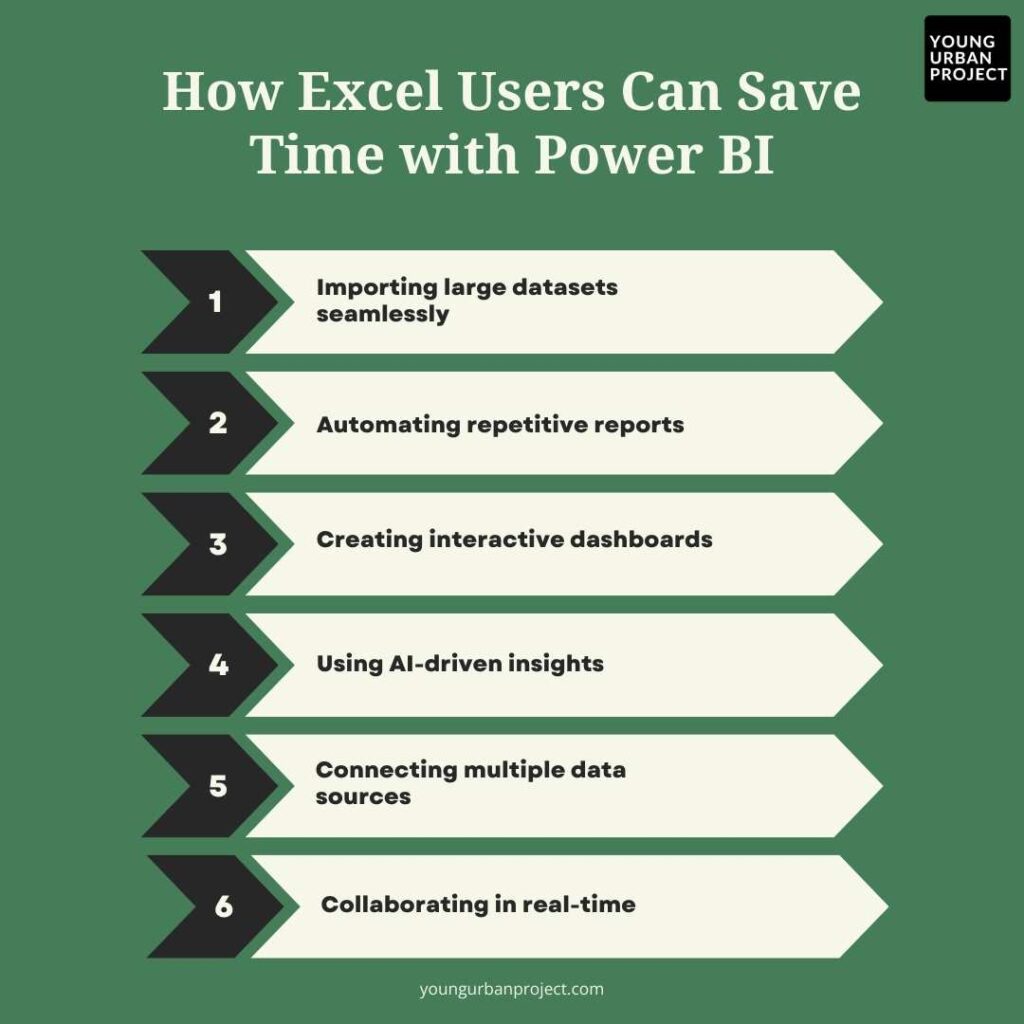
1. Importing large datasets seamlessly
Power BI handles millions of rows without slowing down, unlike Excel which struggles with large files. Simply connect Power BI to your data sources, and it pulls in information without size limitations. This means no more splitting files, removing rows, or waiting for large spreadsheets to calculate. Even better, once connected, you can refresh data with one click rather than manual imports.
2. Automating repetitive reports
Say goodbye to rebuilding the same report every week or month. Create a report once in Power BI, and schedule automatic refreshes at whatever frequency you need. The system pulls in fresh data, updates all calculations and charts, and distributes the new report—all without you lifting a finger. This automation saves hours of repetitive work and ensures everyone has current information.
3. Creating interactive dashboards
Transform static Excel reports into clickable, interactive experiences. Power BI dashboards let users filter data instantly by clicking on charts or using dropdown menus. They can drill down from summary information to detailed records without needing separate reports. This interactivity gives everyone the power to find their own answers rather than requesting new reports from analysts.
4. Using AI-driven insights
Power BI’s built-in AI tools automatically find patterns and anomalies that would take hours to discover manually in Excel. The Quick Insights feature analyzes your data and suggests interesting findings you might have missed. Ask questions in plain language, and AI provides visual answers. These capabilities help even non-technical users uncover meaningful insights without complex analysis.
5. Connecting multiple data sources
While Excel typically works with one file at a time, Power BI easily combines data from many sources. Connect simultaneously to Excel files, databases, online services, and cloud applications to create a complete picture of your business. Power BI remembers these connections and refreshes all sources when updated. This integration eliminates manual copying and pasting between different data sources.
6. Collaborating in real-time
Share Power BI reports with colleagues who can view and interact with the same dashboard simultaneously. Unlike Excel, where sharing often means emailing files back and forth, Power BI publishes reports to a secure online workspace. Team members can leave comments directly on reports, subscribe to automatic updates, and access information from any device, helping everyone stay on the same page.
How to Get Started with Power BI
1. Power BI Desktop vs. Power BI Service
There are two main parts of Power BI. Power BI Desktop is a free program you download to your computer. This is where you build your reports and connect to your data. Power BI Service is the website where you share and view these reports online. Most people use Desktops to create reports and Services to share them with others.
2. Learning Resources: Young Urban Project, Microsoft Learn, & More
If you’re new to Power BI, there are many ways to learn. Microsoft Learn has free guides, and Udemy offers beginner-friendly courses. A great option is Young Urban Project’s Power BI Mastery Course. It’s a self-paced course that helps learners build real-world dashboards and automate data tasks, even if they have no prior experience.
3. Certifications for Power BI Professionals
Getting certified in Power BI can help in jobs and career growth. Microsoft offers the PL-300 certification, which tests your skills in preparing and analyzing data. Young Urban Project also provides certification with their Power BI Mastery Course, which helps learners showcase their skills to employers.
Conclusion: Power BI vs Excel
Choosing between Excel and Power BI depends on what you’re trying to do. Excel is still the go-to tool for spreadsheets, quick calculations, and working with data yourself. Power BI shines when dealing with large amounts of data, making interactive reports, or sharing insights across your company.
Most people end up using both: Excel for everyday data work and Power BI for bigger reporting needs. Start with the tool that solves your main problems right now. Learn both if you can, since they work best together. Remember that the tools don’t matter as much as getting useful insights from your data to make good decisions. The best approach is usually using Excel and Power BI as a team, each doing what it’s best at.
FAQs: Power BI vs Excel
1. Is Power BI really better than Excel?
Neither is better overall – they do different jobs. Excel is better for typing in data, simple analysis, and working alone. Power BI is better for big data, making interactive charts, and sharing with many people. Choose based on what you need to do.
2. Will Power BI replace Excel?
No. Excel isn’t going anywhere. Most companies use both tools together. Excel is still the best spreadsheet program, while Power BI handles the bigger data tasks and sharing. They work as partners rather than competitors.
3. Which should I learn first: Excel or Power BI?
Learning some Excel basics first helps. Many Power BI ideas make more sense if you already know Excel concepts like tables and formulas. But if your job is mainly about making dashboards, you could learn both at the same time.
4. Can Power BI and Excel work together?
Yes! You can use Excel data in Power BI reports. You can put Power BI charts in Excel. You can export Power BI data to Excel for more work. Microsoft made them to work well together, so you can use each for what it does best.
5. What are the hardware requirements for running Power BI vs. Excel?
Excel runs on most computers. Power BI Desktop needs at least 1GB of memory (4GB is better), 1.5GB of hard drive space, and a decent graphics card. More memory helps both programs when working with lots of data. Power BI Service works in your web browser.
6. Can Power BI handle real-time data updates better than Excel?
Yes, much better. Power BI can connect to live data and update automatically. Excel needs you to manually refresh or use complex coding to do the same thing. If your data changes often, Power BI saves a lot of time with automatic updates.
7. Which businesses or professionals benefit most from Power BI?
Power BI helps most in businesses with lots of data like retail, banking, healthcare, and manufacturing. It’s great for people who track sales numbers, make reports, or need to share insights with their team. Smaller businesses might be fine with Excel until they grow bigger.

